MANIC FM

Saturday, October 2, 2010

Drawing graphs

Drawing graphs

Graphs are represented graphically by drawing a dot for every vertex, and drawing an arc between two vertices if they are connected by an edge. If the graph is directed, the direction is indicated by drawing an arrow.
A graph drawing should not be confused with the graph itself (the abstract, non-visual structure) as there are several ways to structure the graph drawing. All that matters is which vertices are connected to which others by how many edges and not the exact layout. In practice it is often difficult to decide if two drawings represent the same graph. Depending on the problem domain some layouts may be better suited and easier to understand than others.

Graph-theoretic data structures

There are different ways to store graphs in a computer system. The data structure used depends on both the graph structure and the algorithm used for manipulating the graph. Theoretically one can distinguish between list and matrix structures but in concrete applications the best structure is often a combination of both. List structures are often preferred for sparse graphs as they have smaller memory requirements. Matrix structures on the other hand provide faster access for some applications but can consume huge amounts of memory.

List structures

Incidence list 
The edges are represented by an array containing pairs (tuples if directed) of vertices (that the edge connects) and possibly weight and other data. Vertices connected by an edge are said to be adjacent.
Adjacency list 
Much like the incidence list, each vertex has a list of which vertices it is adjacent to. This causes redundancy in an undirected graph: for example, if vertices A and B are adjacent, A's adjacency list contains B, while B's list contains A. Adjacency queries are faster, at the cost of extra storage space.

 Matrix structures

Incidence matrix 
The graph is represented by a matrix of size |V| (number of vertices) by |E| (number of edges) where the entry [vertex, edge] contains the edge's endpoint data (simplest case: 1 - incident, 0 - not incident).
Adjacency matrix 
This is an n by n matrix A, where n is the number of vertices in the graph. If there is an edge from a vertex x to a vertex y, then the element ax,y is 1 (or in general the number of xy edges), otherwise it is 0. In computing, this matrix makes it easy to find subgraphs, and to reverse a directed graph.
Laplacian matrix or Kirchhoff matrix or Admittance matrix 
This is defined as DA, where D is the diagonal degree matrix. It explicitly contains both adjacency information and degree information. (However, there are other, similar matrices that are also called "Laplacian matrices" of a graph.)
Distance matrix 
A symmetric n by n matrix D whose element dx,y is the length of a shortest path between x and y; if there is no such path dx,y = infinity. It can be derived from powers of A
d_{x,y}=\min\{n\mid A^n[x,y]\ne 0\}. \,

Problems in graph theory

Enumeration

There is a large literature on graphical enumeration: the problem of counting graphs meeting specified conditions. Some of this work is found in Harary and Palmer (1973).

Subgraphs, induced subgraphs, and minors

A common problem, called the subgraph isomorphism problem, is finding a fixed graph as a subgraph in a given graph. One reason to be interested in such a question is that many graph properties are hereditary for subgraphs, which means that a graph has the property if and only if all subgraphs have it too. Unfortunately, finding maximal subgraphs of a certain kind is often an NP-complete problem.
A similar problem is finding induced subgraphs in a given graph. Again, some important graph properties are hereditary with respect to induced subgraphs, which means that a graph has a property if and only if all induced subgraphs also have it. Finding maximal induced subgraphs of a certain kind is also often NP-complete. For example,
Still another such problem, the minor containment problem, is to find a fixed graph as a minor of a given graph. A minor or subcontraction of a graph is any graph obtained by taking a subgraph and contracting some (or no) edges. Many graph properties are hereditary for minors, which means that a graph has a property if and only if all minors have it too. A famous example:
Another class of problems has to do with the extent to which various species and generalizations of graphs are determined by their point-deleted subgraphs, for example:

Graph theory

In mathematics and computer science, graph theory is the study of graphs: mathematical structures used to model pairwise relations between objects from a certain collection. A "graph" in this context refers to a collection of vertices or 'nodes' and a collection of edges that connect pairs of vertices. A graph may be undirected, meaning that there is no distinction between the two vertices associated with each edge, or its edges may be directed from one vertex to another; see graph (mathematics) for more detailed definitions and for other variations in the types of graphs that are commonly considered. The graphs studied in graph theory should not be confused with "graphs of functions" and other kinds of graphs.
Graphs are one of the prime objects of study in Discrete Mathematics. Refer to Glossary of graph theory for basic definitions in graph theory.

History

The Königsberg Bridge problem
The paper written by Leonhard Euler on the Seven Bridges of Königsberg and published in 1736 is regarded as the first paper in the history of graph theory.[1] This paper, as well as the one written by Vandermonde on the knight problem, carried on with the analysis situs initiated by Leibniz. Euler's formula relating the number of edges, vertices, and faces of a convex polyhedron was studied and generalized by Cauchy[2] and L'Huillier,[3] and is at the origin of topology.
More than one century after Euler's paper on the bridges of Königsberg and while Listing introduced topology, Cayley was led by the study of particular analytical forms arising from differential calculus to study a particular class of graphs, the trees. This study had many implications in theoretical chemistry. The involved techniques mainly concerned the enumeration of graphs having particular properties. Enumerative graph theory then rose from the results of Cayley and the fundamental results published by Pólya between 1935 and 1937 and the generalization of these by De Bruijn in 1959. Cayley linked his results on trees with the contemporary studies of chemical composition.[4] The fusion of the ideas coming from mathematics with those coming from chemistry is at the origin of a part of the standard terminology of graph theory.
In particular, the term "graph" was introduced by Sylvester in a paper published in 1878 in Nature, where he draws an analogy between "quantic invariants" and "co-variants" of algebra and molecular diagrams:[5]
"[...] Every invariant and co-variant thus becomes expressible by a graph precisely identical with a Kekuléan diagram or chemicograph. [...] I give a rule for the geometrical multiplication of graphs, i.e. for constructing a graph to the product of in- or co-variants whose separate graphs are given. [...]" (italics as in the original).
One of the most famous and productive problems of graph theory is the four color problem: "Is it true that any map drawn in the plane may have its regions colored with four colors, in such a way that any two regions having a common border have different colors?" This problem was first posed by Francis Guthrie in 1852 and its first written record is in a letter of De Morgan addressed to Hamilton the same year. Many incorrect proofs have been proposed, including those by Cayley, Kempe, and others. The study and the generalization of this problem by Tait, Heawood, Ramsey and Hadwiger led to the study of the colorings of the graphs embedded on surfaces with arbitrary genus. Tait's reformulation generated a new class of problems, the factorization problems, particularly studied by Petersen and Kőnig. The works of Ramsey on colorations and more specially the results obtained by Turán in 1941 was at the origin of another branch of graph theory, extremal graph theory.
The four color problem remained unsolved for more than a century. In 1969 Heinrich Heesch published a method for solving the problem using computers[6]. A computer-aided proof produced in 1976 by Kenneth Appel and Wolfgang Haken makes fundamental use of the notion of "discharging" developed by Heesch[7][8]. The proof involved checking the properties of 1,936 configurations by computer, and was not fully accepted at the time due to its complexity. A simpler proof considering only 633 configurations was given twenty years later by Robertson, Seymour, Sanders and Thomas.[9]
The autonomous development of topology from 1860 and 1930 fertilized graph theory back through the works of Jordan, Kuratowski and Whitney. Another important factor of common development of graph theory and topology came from the use of the techniques of modern algebra. The first example of such a use comes from the work of the physicist Gustav Kirchhoff, who published in 1845 his Kirchhoff's circuit laws for calculating the voltage and current in electric circuits.
The introduction of probabilistic methods in graph theory, especially in the study of Erdős and Rényi of the asymptotic probability of graph connectivity, gave rise to yet another branch, known as random graph theory, which has been a fruitful source of graph-theoretic results.

Sunday, August 8, 2010

SYMBOLS IN PLENTY

1.Which of the following is the normal practice of representing 'Ad infinitum'?
   a)Colon
   b)A dash
   c)Three dots
   d)A semi-colon

2.The symbol of infinity is basically:
   a)A cabal symbol
   b)A Greak letter
   c)A curve
   d)A hebrew letter

 3.The multiplication symbol 'x' has its origin in:
   a)St.Andrews cross
   b)The Hindu number system
   c)The Babylonian script
   d)The unknown x

 4.The addition symbol + has its origin in:
    a)The Latin et
    b)An Indian traders book
    c)The Arabic script
    d)The Italian piu

 5.The square root of minus one is represented by i and it stands for:
    a)improbable
    b)imaginary
    c)impossible
    d)none of the above

 6.The integral  sign stands for a short form of:
    a)the sum
    b)the summary
    c)the smallest part
    d) the smartest part

 7.The symbol in Geometry stands for:
    a)Parallel lines
    b)Equilateral triangles
    c)Isosceles triangles
    d)Congruent triangles

 8.The symbol 'Aleph' employed in set theory is originally a:
    a)Latin letter
    b)Sanskrit letter
    c)Hebrew letter
    d)None of this

 9.IN arithmetic, % is the symbol of:
    a)per cent
    b)per mil
    c)proportional
    d)ratio

10.In geometry, is the symbol of:
    a)annulus
    b)circle
    c)concentric circle
    d)centre

 11.The origin of the symbol     is:
    a)The letter z
    b)The letter r
    c)The elongated from of z
    d)None of these

12.It is the number 10 of this equation log 100=2. It mathematically stands for:
     a)Bar
     b)Vector
     c)Base
     d)Terminal


 ANSWRES

 1. c)Three dots
 2. c)A curve
 3. a)St.Andrews cross
 4. a)The Latin et
 5. c)impossible
 6. a)the sum
 7. d)Congruent triangles
 8. c)Hebrew letter
 9. a)per cent
10. b)circle
11. b)The letter r
12. c)Base


Friday, August 6, 2010

MULTIPLES USED WITH S.I. UNITS

             DECIMAL MULTIPLES AND MULTIPLES USED 
                                 WITH S.I. UNITS


Multiple
Prefix
Symbol
10
Deca
da
100
Hecto
h
1000
Kilo
k
106
Mega
M
109
Giga
G
1012
Tera
T
1015
Reta
P
1018
Exa
E

Submultiple
Prefix
Symbol
10-1
Deci
d
10-2
Centi
c
10-3
Milli
m
10-6
Micro
μ
10-8
Atto
η
10-9
Nano
p
10-12
Pico
f
10-15
Femto
a

Saturday, July 24, 2010

Vectors Calaulus 1.36


Practice Final
Please work out each of the given problems.  Credit will be based on the steps that you 
show towards the final answer.  Show your Work

Problem 1 
Please answer the following true or false.  If false, explain why or provide a counter example. 
If true, explain why.
A.  Let Q be a three dimensional solid and let 
        F(x,y,z)  =  (x2y + sin z)i+ (cos x - xy2)j + (3xy + z)k
and let S be the boundary of Q with outwardly pointing normal.  The the volume so Q is given by
       
True,
We have
        divF  =  2xy - 2xy + 1  =  1
Using the divergence theorem, we see that 
       
which is just the volume of the solid.


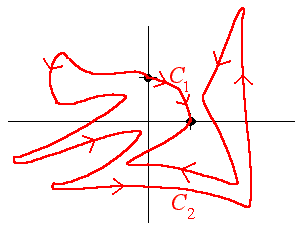
B.  Let F  =  3xy i + cosx j and let C1 and C2 be as shown below.  Then


C.  A new particle, the fluxon, has been discovered to be emitted from the sun.  The particle emits 
a force field 
        F(x,y,z)  =  (y2 - z) i + (x2 - z) j + (x2 + y2) k
where the origin represents the center of the sun.  If the total flux through the earth's northern
hemisphere has been calculated as 10,000, then the total flux through the earth's southern hemisphere 
must also be 10,000.
Solution
False,  since divF  =  0, the total flux must be zero.  If the flux through the northern hemisphere is  
10,000, then the flux through the southern hemisphere must be -10,000.

Problem 2  
 You are the captain of the spaceship Potential that you have programmed to follow the vector-valued function 
        r(t) =  (t2 + 5) i + (t - 3) j + t3 k 
where t is measured in hours.  However, at time t  =  2, your engines fail and your ship begins
drifting in deep space.  There is a deep space station located at (6,2,38).  
A.  Find the vector-valued function that describes the Potential's flight after the engines failed. 
Use t  =  2 to represent the time at which your engines first shut down. (Hint:  This should be a
linear vector valued function.)
The flight will go in a linear path in the direction of the unit tangent vector with speed equal to the
speed when the engines fail.  We have
        r'(t)  =  2t i + j + 3t2 k
        r'(2)  =  4i + j + 12k
When t  =  2, the spacecraft is at 
        r(2)  =  9i - j + 8k 
The flight can be described by
        rf(t)  =  r(2) + (t - 2)r'(2)  =  9i - j + 8k + (t - 2)(4i + j + 12k)
        =  (1 + 4t)i + (-3 + t)j + (-16 + 12t)k 

B.  Will your ship make it to the station, or will you float helplessly for eternity?
Solution
We are looking for a time t with 
        rf(t)  = 6i + 2j + 38j
Setting the j components equal we get
        -3 + t  =  3        t  =  5
However
        rf(5)  =  9i + 2j + 44k
since the i and k components of rf and the station are different, we can conclude that our 
spaceship will drift away to eternity.


Problem 3 
Show that the helix
        r(t)  =  (R cos t) i + (R sin t) j + t k 
where R is a positive constant, has the property that N(t) . r(t) is a constant.  Find this constant.
We first calculate T(t)
        r'(t)  =  (-R sin t) i + (R cos t) j + k 
        || r'(t)||  =  (R2 sin2 t + R2 cos2 t + 1)1/2  =  (R2 + 1)1/2
Hence
        T(t)  =  (R2 + 1)-1/2 [(-R sin t) i + (R cos t) j + k]
Next, we have
        T'(t)  =  (R2 + 1)-1/2 [(-R cos t) i + (-R sin t) j]
and
        ||T'(t)||  =  (R2 + 1)-1/2 [R2 cos2 t + R2 sin2 t]1/2  =   (R2 + 1)-1/2 [R] 
Dividing gives
        N(t)  =  -cos t i - sin t j
Finally, we take the dot product
        N(t) . r(t)  =  [(R cos t) i + (R sin t) j + t k] . [-cos t i - sin t j]
        =  R cos2 t + R sin2 t  =  R

Problem 4 
  The probability density function for an event is given by
       
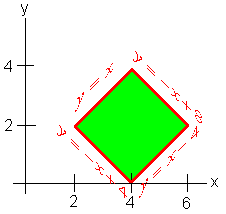
where R is the square with vertices (4,0), (6,2), (4,4), and (2,2).
A.  Use the appropriate change of variables (Jacobians) to find k that is solve 
       
We sketch the picture and find the equation of the four lines that border the square.
       
We can also write
        0  <  x - y  < 4        and        4  <  x + y  <  8
We let 
        u  =  x - y        v  =  x + y
Adding the two equations gives
        u + v  =  2x        x  =  1/2 (u + v)
Subtracting the two equations gives
        v - u  =  2y        y  =  1/2 (v - u)
We can compute the Jacobian
       
We have
               
Setting this equal to 1 gives
                    3
        k  =                   
                  896


B.  Find the probability that  <  x - y  <  1
Solution
Since
        u  =  x - 1
we just adjust the limits appropriately
       

Problem 5  
Switch the order of integration and write as one double integral
       
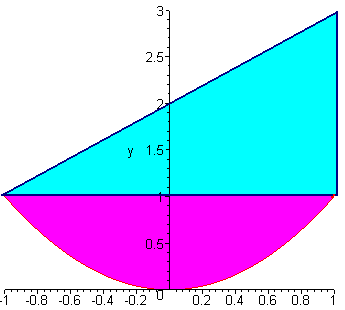
The key to this problem is to sketch the picture which is shown below
       
Now we can realize the region as being bounded from below by y  =  x2 and above by y  =  x + 2.
We have


Problem 6 
Set up the integrals that give the following.  Use the most appropriate coordinate system.
A.  The mass of the solid that lies inside the sphere
        x2 + y2 + z2  =  9
and outside the cone
        z2  =  x2 + y2 
that has density function
       
We use spherical coordinates.  The sphere becomes
        r  =  3
and to find the equation of the cone, we add z2 to both sides to get
        2z2  =  x2 + y2 + z2 
        2r2cos2 f  =  r2         cos2 f  = 1/2        f  =  p/4
Now we can write
       
B.  The surface area of the part of the paraboloid 
        z  =  x2 + y2
that lies inside the cylinder
        x2 + y2  =  4
Solution
We calculate the partials
        zx  =  2x        zy  =  2y        (1 + zz + zy)1/2  =  (1 + 4x2 + 4y2)1/2
Since the region is a circle of radius 2, we convert to polar coordinates to get


Problem 7  
Find the work done by the force field 
        F(x,y)  =  (3x2 - y) i + (x2 - y3) j
as a particle moves counterclockwise around the rectangle with vertices (2,1), (5,1), (5,5), and (2,5).
We use Green's Theorem.  We have
        Nx - My  =  2x + 1
We have
       

Problem 8
Verify Stokes Theorem where 
        F(x,y,z)  =  (2x) i + (2y) j + (z sin z3) k
and S is part of the paraboloid 
        z  =  9 - x2 - y2 
that lies above the plane z  =  8 oriented upward.
We first compute the line integral 
       
We notice that the intersection of the paraboloid and the plane is given by 
        9 - x2 - y2  =  8        x2 + y2  =  1
This is the circle of radius 1 raised 8 units above the xy-plane.  Its parameterization is given by
        r(t)  =  (cos t) i + (sin t) j + 8k 
        r'(t)  =  (-sin t) i + (cos t) j  
so that 
        F . dr  =  [(2cos t) i + (2sin t) j + (8 sin 83) k] . [(-sin t) i + (cos t) j]
        =  -2 sin t cos t + 2 sin t cos t  =  0
Since the integrand is zero, so is the integral.
Now we use Stokes Theorem.  We have 
       
So that the surface integral is zero.